After seeing an announcement about it on R-Bloggers, I decided to test out the new xray package using the Titanic data set. The xray package provides a few functions for quickly getting a summary of anomalies and distributions of the variables in a data set. For anomalies, the anomalies() function outputs the number and percentage of NA’s, zeroes, empty strings, and infinities while also giving some useful information about distinct observations and variable class. For distributions, the distributions() function outputs boxplots and histograms of each variable. For numerical variables, the histograms also have a density curve overlay. These plots give a good starting point for further analysis.
I used the Titanic data set hosted by Kaggle to play around with the xray package. Below is a partial reproduction of my Kaggle kernel showing an exploratory data analysis of the Titanic data set using xray. For the full analysis, see the linked kernel.
Titanic EDA Using xray Package
To get a sense for the Titanic data set, we are going to do some exploratory data analysis. As part of that, we will use the xray package to check for anomalies and look at distributions.
library(tidyverse)
library(xray)
library(knitr)
Data Import
First, we need to import the training.
training <- read_csv("posts_data/train.csv", progress = FALSE)Now, let’s take a look at the data using glimpse().
glimpse(training)## Observations: 891
## Variables: 12
## $ PassengerId <int> 1, 2, 3, 4, 5, 6, 7, 8, 9, 10, 11, 12, 13, 14, 15,...
## $ Survived <int> 0, 1, 1, 1, 0, 0, 0, 0, 1, 1, 1, 1, 0, 0, 0, 1, 0,...
## $ Pclass <int> 3, 1, 3, 1, 3, 3, 1, 3, 3, 2, 3, 1, 3, 3, 3, 2, 3,...
## $ Name <chr> "Braund, Mr. Owen Harris", "Cumings, Mrs. John Bra...
## $ Sex <chr> "male", "female", "female", "female", "male", "mal...
## $ Age <dbl> 22, 38, 26, 35, 35, NA, 54, 2, 27, 14, 4, 58, 20, ...
## $ SibSp <int> 1, 1, 0, 1, 0, 0, 0, 3, 0, 1, 1, 0, 0, 1, 0, 0, 4,...
## $ Parch <int> 0, 0, 0, 0, 0, 0, 0, 1, 2, 0, 1, 0, 0, 5, 0, 0, 1,...
## $ Ticket <chr> "A/5 21171", "PC 17599", "STON/O2. 3101282", "1138...
## $ Fare <dbl> 7.2500, 71.2833, 7.9250, 53.1000, 8.0500, 8.4583, ...
## $ Cabin <chr> NA, "C85", NA, "C123", NA, NA, "E46", NA, NA, NA, ...
## $ Embarked <chr> "S", "C", "S", "S", "S", "Q", "S", "S", "S", "C", ...We have 12 variables that we will want to look at. According to the data set description from Kaggle, the variables are defined in the following way:
- PassengerId – A numerical id for each passenger.
- Survived – The response variable as a factor showing survival.
- Pclass – The ticket class of the passenger used as a proxy for socio-economic class. This variable is a factor with levels 1 = 1st (Upper Class), 2 = 2nd (Middle Class), and 3 = 3rd (Lower Class).
- Name – The full name of the passenger with title. Married female passengers appear to have their partner’s name listed with their actual name in parentheses.
- Sex – A factor showing the sex of the passenger.
- Age – The age of the passenger. Estimated ages are given as xx.#.
- SibSp – The number of siblings and spouses the passnger has aboard.
- Parch – The number of parent/children relationships that the passneger has aboard.
- Ticket – Ticket number of the passenger.
- Fare – The passenger fare.
- Cabin – The passenge cabin number.
- Embarked – The port of embarkation. This is a factor with three levels C = Cherbourg, Q = Queenstown, S = Southampton.
Before we begin the exploration, let’s recode the factors with proper levels.
training <- training %>%
  mutate(Survived = factor(Survived,
                           levels = c(1, 0),
                           labels = c("Yes", "No"))) %>%
  mutate(Pclass = factor(Pclass,
                         levels = c(3, 2, 1),
                         labels = c("3rd", "2nd", "1st"),
                         ordered = TRUE)) %>%
  mutate(Sex = factor(Sex,
                      levels = c("male", "female"))) %>%
  mutate(Embarked = factor(Embarked,
                           levels = c("C", "Q", "S"),
                           labels = c("Cherbourg", "Queenstown", "Southampton")))
Exploration with xray
Checking Anomalies with xray
Now that the data sets have been re-coded with factors, let’s take a look for any anomalies in the data set using the xray package. The xray package gives access to several functions for performing exploratory data analysis. The first one we will use is the anomalies() function that returns a data frame summarizing the variables in a provided data frame.
The function returns summaries for each variable showing:
- The number of observations
- The number and percentage of observations that are NA
- The number and percentage of observations that are zero
- The number and percentage of observations that are blank
- The number and percentage of observations that are infinite
- The number of distinct observations
- The variable type
- The percentage of observations that are “anomalous”
This information can give us a starting point to examine the data set and see what variables will be useful for training our models.
xray::anomalies(training)$variables %>%
knitr::kable()| Variable | q | qNA | pNA | qZero | pZero | qBlank | pBlank | qInf | pInf | qDistinct | type | anomalous_percent |
|---|---|---|---|---|---|---|---|---|---|---|---|---|
| Cabin | 891 | 687 | 77.1% | 0 | - | 0 | - | 0 | - | 148 | Character | 77.1% |
| Parch | 891 | 0 | - | 678 | 76.09% | 0 | - | 0 | - | 7 | Integer | 76.09% |
| SibSp | 891 | 0 | - | 608 | 68.24% | 0 | - | 0 | - | 7 | Integer | 68.24% |
| Age | 891 | 177 | 19.87% | 0 | - | 0 | - | 0 | - | 89 | Numeric | 19.87% |
| Fare | 891 | 0 | - | 15 | 1.68% | 0 | - | 0 | - | 248 | Numeric | 1.68% |
| Embarked | 891 | 2 | 0.22% | 0 | - | 0 | - | 0 | - | 4 | Factor | 0.22% |
| Survived | 891 | 0 | - | 0 | - | 0 | - | 0 | - | 2 | Factor | - |
| Sex | 891 | 0 | - | 0 | - | 0 | - | 0 | - | 2 | Factor | - |
| Pclass | 891 | 0 | - | 0 | - | 0 | - | 0 | - | 3 | Unknown | - |
| Ticket | 891 | 0 | - | 0 | - | 0 | - | 0 | - | 681 | Character | - |
| PassengerId | 891 | 0 | - | 0 | - | 0 | - | 0 | - | 891 | Integer | - |
| Name | 891 | 0 | - | 0 | - | 0 | - | 0 | - | 891 | Character | - |
From calculating the anomalies on the training data, we can see that most of the entries in the Cabin variable are NA. There are two options with this entry as we can either remove the Cabin variable entirely or recode all of the NA’s as “No Cabin” or some similar value. We will investigate the other two variables with NA’s below to see if we can turn them into something useful.
There are also three variables that show a number of zero observations. For the Parch and SibSp variables, this should be fine. This just means that those passengers are traveling without family members. For the fare, we may want to investigate which of the passengers have zero fare as they may be crew members or have some other identifying information.
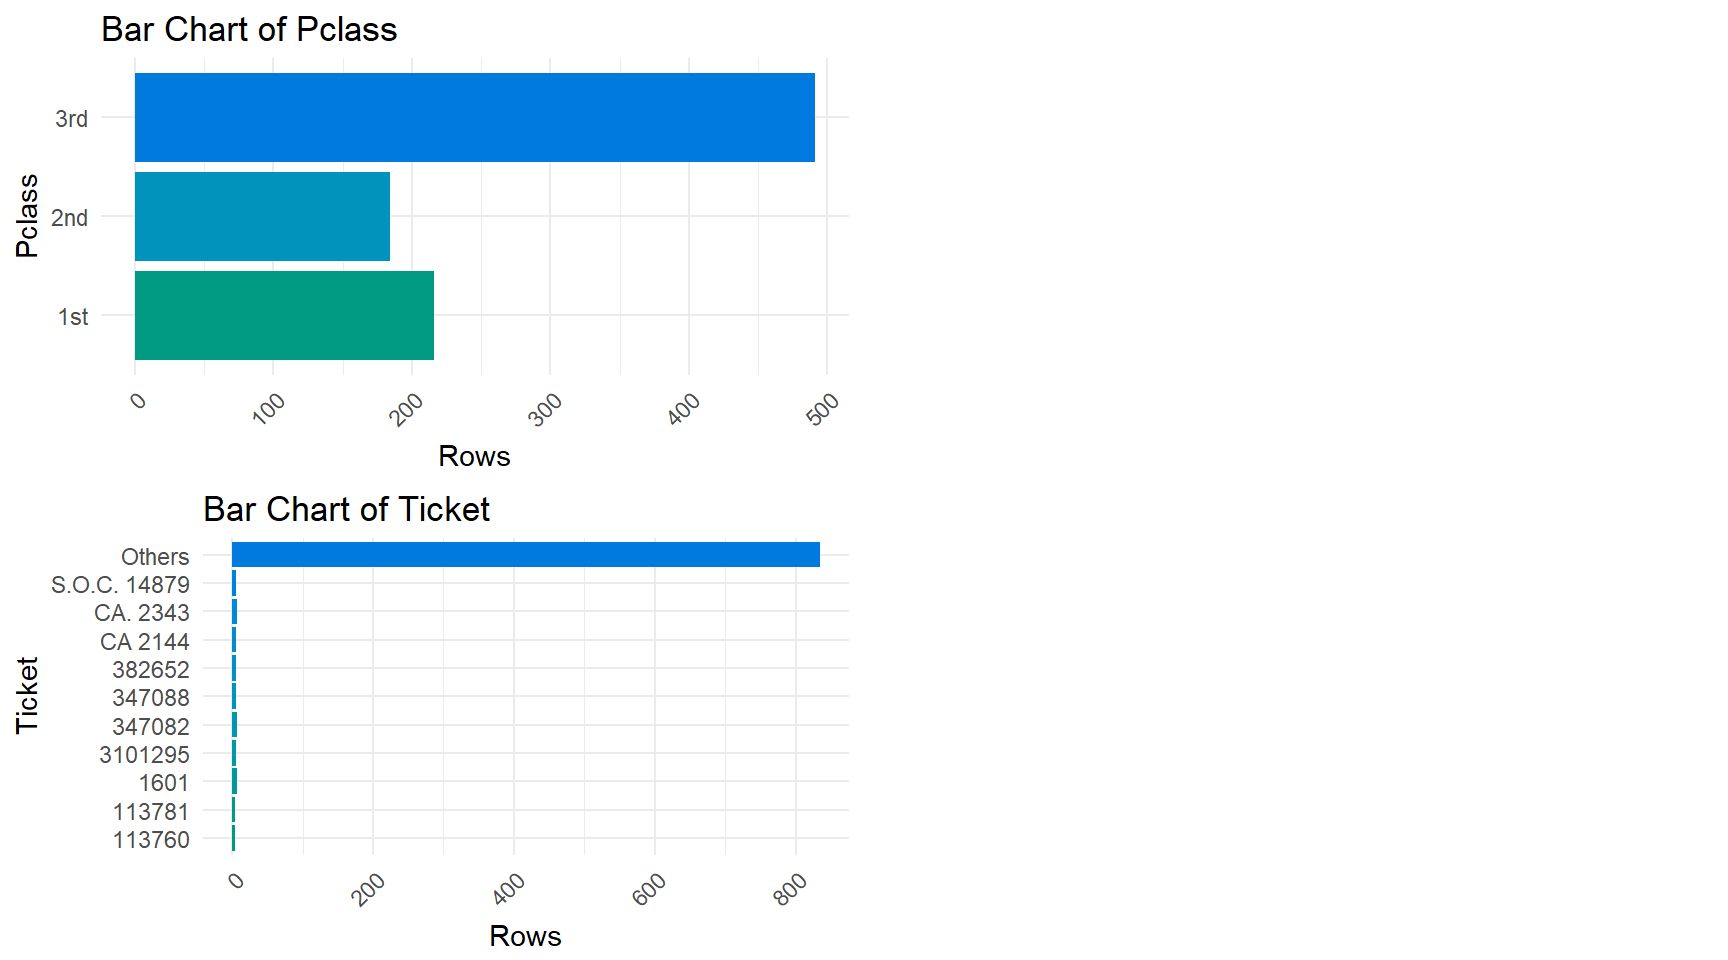
One interesting point that pops out from the anomalies function is that the Ticket variable has only 681 distinct observations. This means that there must be a few repeat tickets that bears a quick investigation.
Note: As of this writing, the xray does not currently support ordered factors. This is why the Pclass variable has a class of “Unknown” from the anomalies() function. This will also cause a problem with the distributions() function so we will remove the ordering for that. This has been fixed in the current iteration of the package available on Github.
Distributions with xray
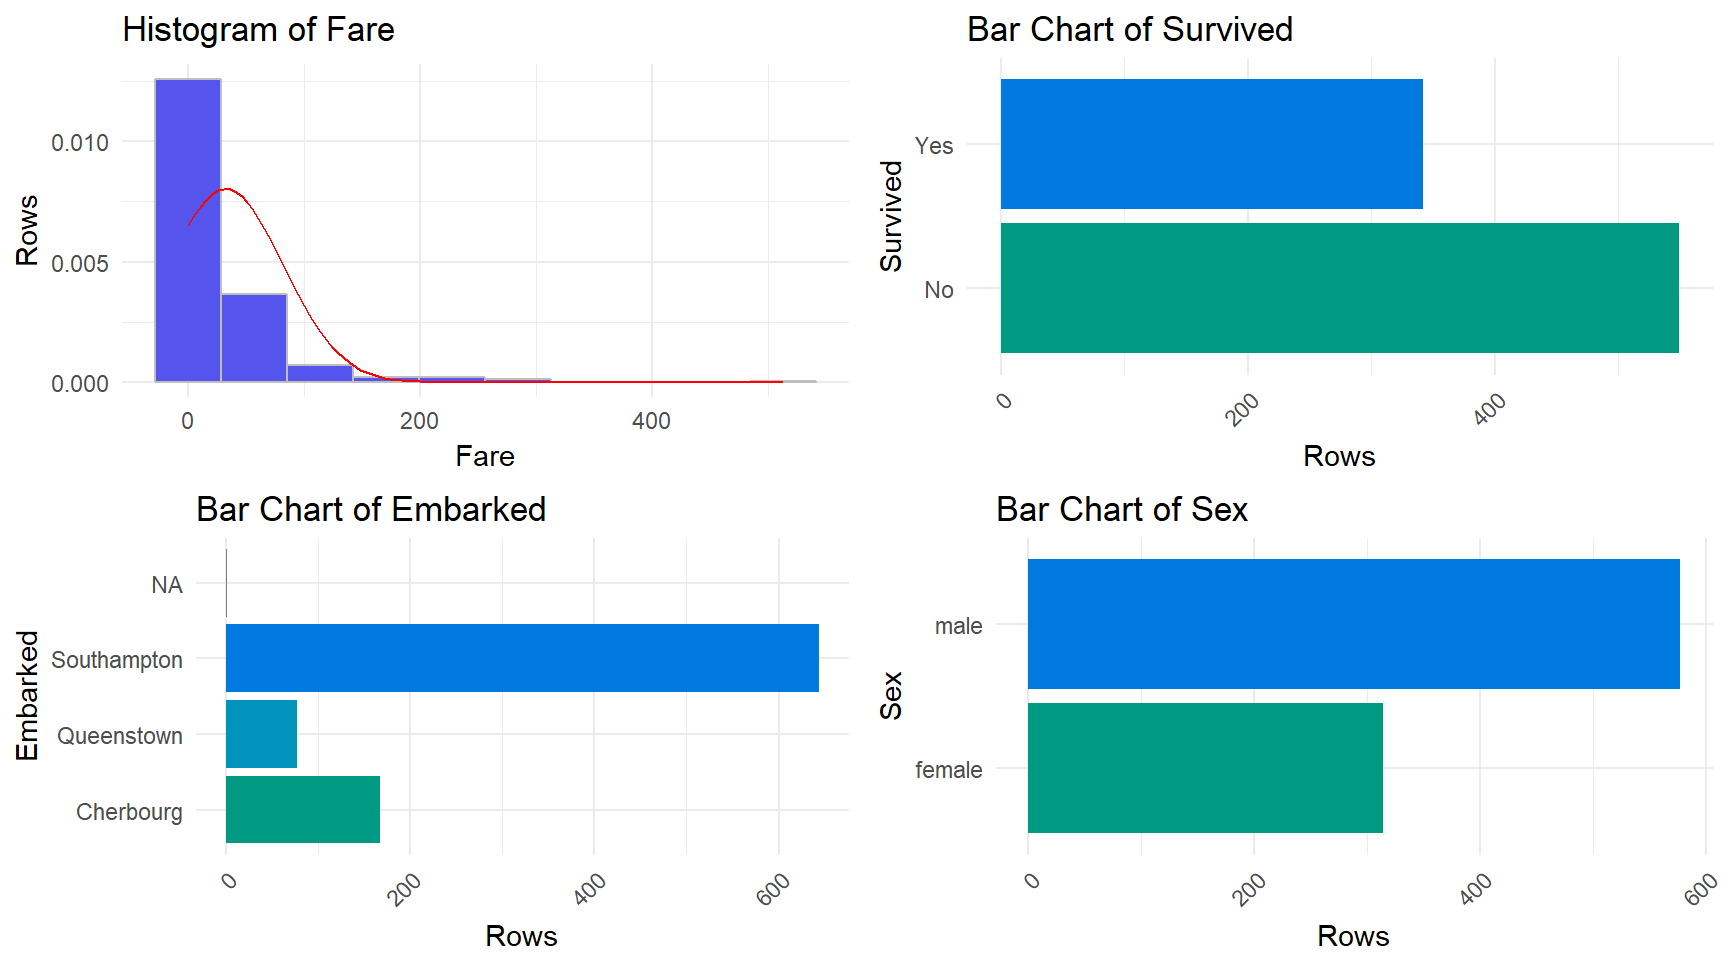
Next, we will use the distributions() function from the xray package to visually inspect the variables. This function returns a series of box plots (for categorical variables) and histograms (for numerical variables) along with giving some distributions and breakdowns for the numerical variables.
For the bar plots, the axis labeled as “Rows” is actually the number of observations of each variable category. For the histograms, the number of observations has been scaled for the associated density plot.
training %>%
  select(-PassengerId, -Name) %>%
  mutate(Pclass = factor(Pclass, ordered = FALSE)) %>%
  xray::distributions()
## ===========================================================================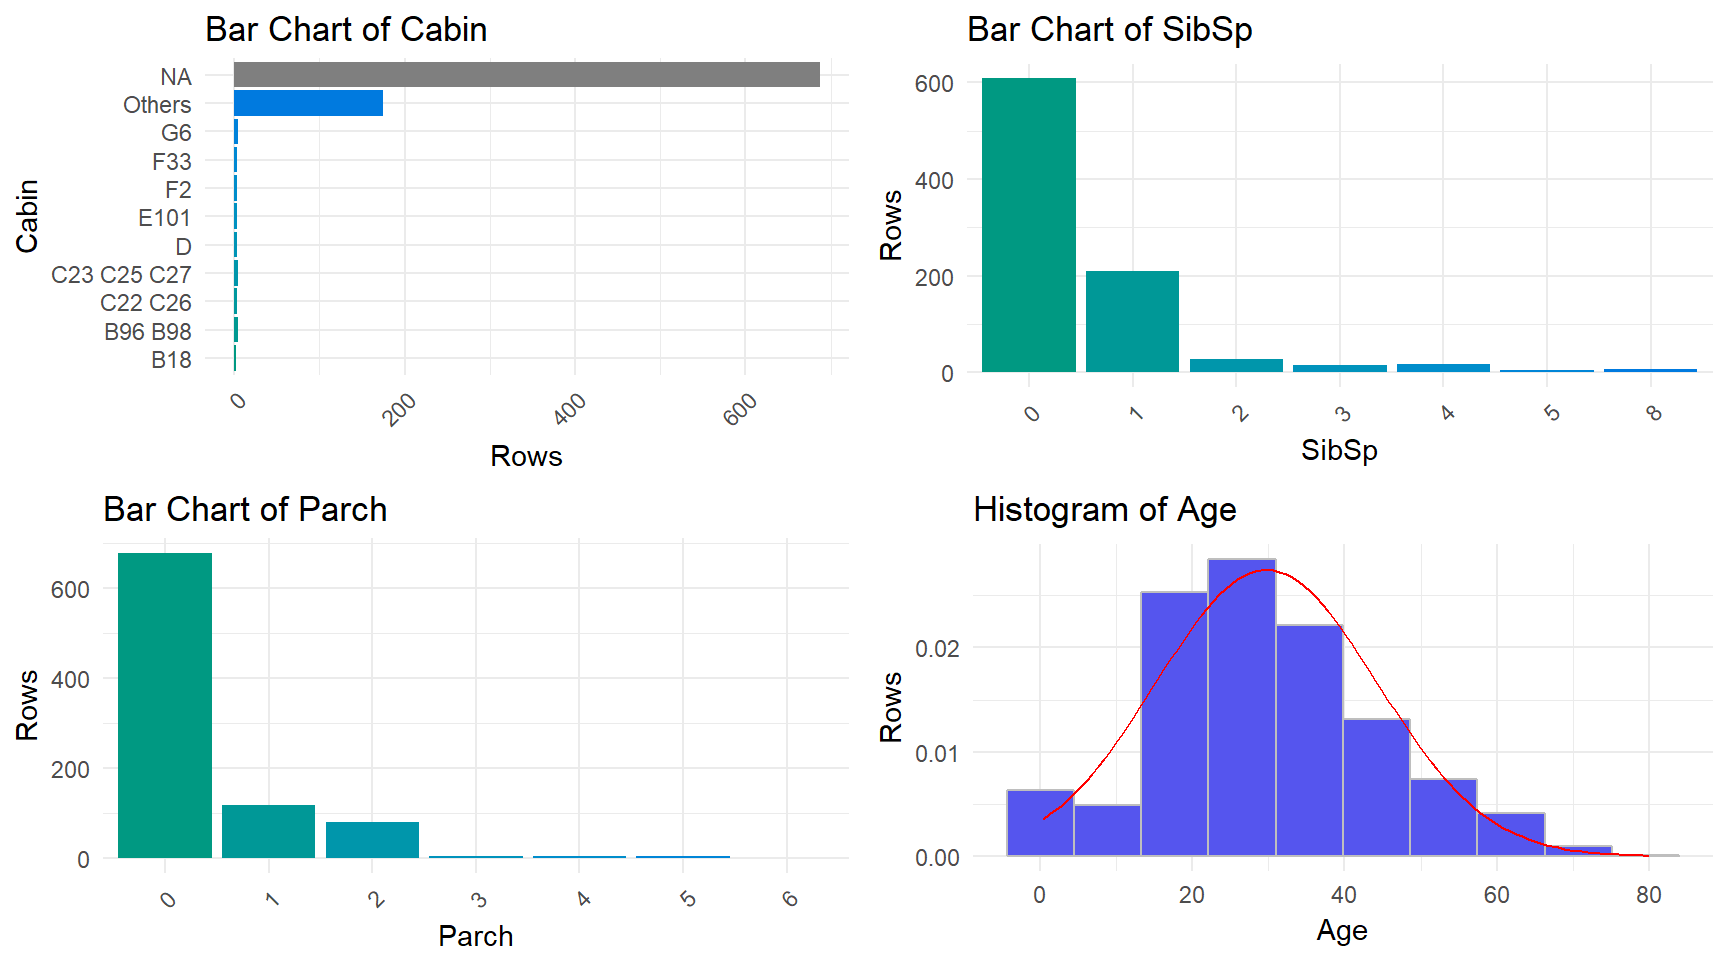
##   Variable p_1 p_10   p_25    p_50 p_75    p_90     p_99
## 1    Parch   0    0      0       0    0       2        4
## 2    SibSp   0    0      0       0    1       1        5
## 3      Age   1   14 20.125      28   38      50    65.87
## 4     Fare   0 7.55 7.9104 14.4542   31 77.9583 249.0062
The distributions() function gives us a very rough visual tool for inspecting the variables. The function allows us to see some general trends and places that could use further checking. For instance, with this data set, it is clear that the fare is being skewed by large outliers. Both the cabin and ticket variables have many categories with low counts that make them hard to visualize with a bar plot. However, the distributions() function works great for the other variables as a means of quick visual analysis.
Thoughts on xray package
The functions in the xray package provide a simple way to quickly glean some insight from unknown data sets. By letting the user pull out information on the anomalies and distributions of variables, the user is able to easily compare the variables and determine which ones require further investigation. It is a wonderful stepping off point for deeper analysis and I look forward to see the package develop further.